
Rated 5/5
Based on over 41,000 reviews
40%
Save up to 40%
100+
Electricity Providers
40+
Natural Gas Providers
Recommended PECO Electricity Plans
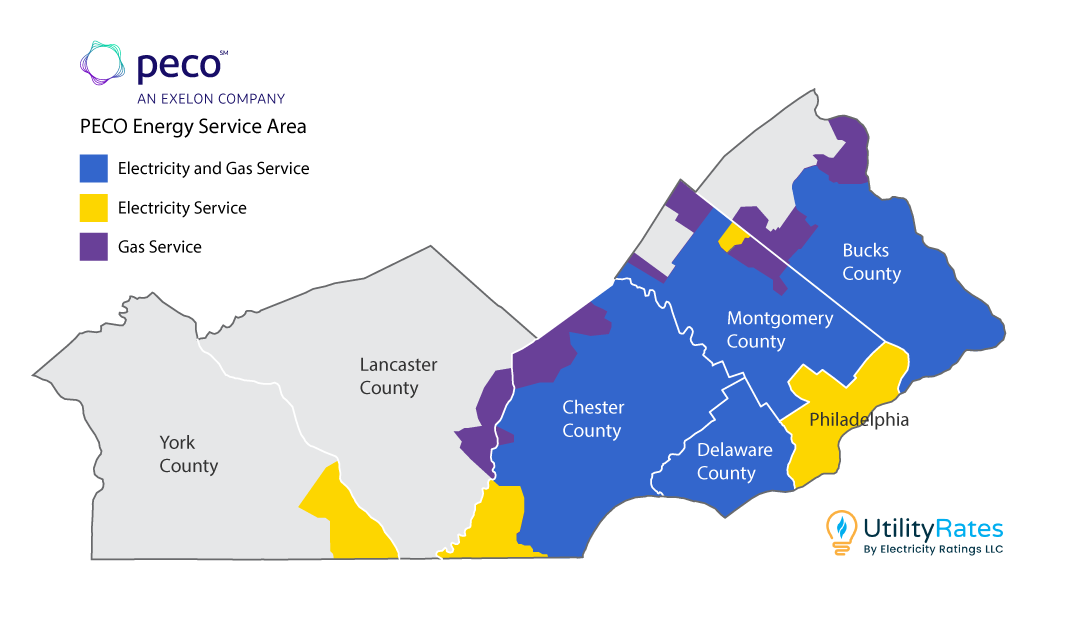
PECO Service Area Map
PECO is Pennsylvanias largest electric and natural gas energy delivery company, serving 1.7 million electric customers and more than 553,000 natural gas customers in southeastern Pennsylvania.
Cities and Counties Served:
Philadelphia
Bucks County
Montgomery Couinty
Chester
Delaware
Lancaster
York
PECO Electricity Rate Price Alert!
The lowest Electricity rate in the service area is 9.590¢ per kwh. That is 18.4% lower than PECO's Price to Compare of 11.759¢ per kwh.
Compare The Best PECO Electricity Rates
We've researched the best providers and plans so you can find a great electricity rate in Pennsylvania
| Company | Term | Rate |
|---|---|---|
| American Power & Gas | 1/months | 7.4¢/kWh |
| Clearview Energy | 6/months | 9.6¢/kWh |
| Indra Energy | 2/months | 10.1¢/kWh |
| Public Power | 12/months | 10.7¢/kWh |
| APG&E | 12/months | 11.2¢/kWh |
| Direct Energy | 6/months | 11.6¢/kWh |
| XOOM Energy | 6/months | 11.7¢/kWh |
| Inspire Clean Energy | 6/months | 11.9¢/kWh |
| Frontier Utilities | 12/months | 12.2¢/kWh |
| Major Energy | 12/months | 13.2¢/kWh |
| Company | Term | Rate |
|---|---|---|
| Constellation | 6/months | 12.7¢/kWh |
| Company | Term | Rate |
|---|---|---|
| Energy Harbor | 12/months | 12.9¢/kWh |
| Green Mountain Energy | 12/months | 13.4¢/kWh |
| Company | Term | Rate |
|---|---|---|
| Santanna Energy Services | 12/months | 14.4¢/kWh |
Compare PECO Business Electricity Rates
You have the power to choose your Commercial and PECO Small Business Electricity Rates. The Utility Rates commercial electricity marketplace is exclusively for business electricity customers looking to start commercial service or compare their existing commercial electricity rates.
PECO business electricity rates are some of the lowest in the US and are 20-30% less than residential rates. So, if you're starting a business or just want to compare PECO commercial electricity rates and shop the market for a better rate, you could save thousands each year by shopping for a lower rate.
PECO Commercial Electricity Rates


What is PECO's Price to Compare (PTC)
The PTC default rate represents the actual price (generation + transmission) the utility pays for the electricity. In other words, it not only includes the generator company's price for making the electricity but also the cost to transmit it from power stations over high tension power lines to PECO's local electrical switch yards. From there, the electricity is distributed throughout the PECO local electrical grid for delivery to homes.
In Pennsylvania, PECO sets its PTC rates by holding auctions to line up their electricity supplies. Currently, auctions are held twice a year to cover four delivery periods. Consequently, PECO's PTC rates change every March 1, June 1, September 1, and December 1. When the auctions are completed, the PAPUC must approve the prices for both the generation supply and transmission.
Key Take Away
For customers, it means these electricity rates can vary seasonally; low some months, higher the next. That's why it's important to lock in a fixed rate for at least 6 Months
The Current PECO Price to Compare is: cents per kWh
NOTE: There are approximately thirty-five borough-owned public power systems in Pennsylvania. These purchase energy for their local residents. Many prohibit residents from shopping for their own provider. If you live in one of these communities, check with your local government to learn more.
PECO Price to Compare - Historical Rates 2018-2026

PECO's Price to Compare - Analysis 2018-2026
Major Events Affecting Prices
PECO Rates: 6.27-6.60 ¢/kWh (remarkably stable)
Natural Gas Context: Post-pandemic recovery beginning, but natural gas prices remained relatively low. Henry Hub averaged around $3-4/MMBtu during this period.
Market Characteristics:
- Low price volatility (only 33¢ range over 9 months)
- Natural gas primarily a domestic commodity
- Limited LNG export pressure on domestic prices
- Affordable energy for Philadelphia-area consumers
Significance: This represents the last period of "normal" pricing before the global energy crisis. Philadelphia-area customers would soon see rates climb 65% from these levels.
What Happened: A severe winter storm hit Texas and Oklahoma, causing widespread natural gas production freeze-offs and multi-day blackouts affecting millions.
PECO Rate: 6.43¢/kWh in February 2021 - still very low and not immediately impacted.
National Impact:
- Natural gas prices briefly spiked nationwide
- Exposed critical infrastructure vulnerabilities
- Depleted natural gas storage inventories
- Set stage for 2022 crisis by creating supply tightness
Why It Mattered: While PECO rates stayed low through 2021, this event demonstrated the interconnected nature of US energy markets and foreshadowed the volatility to come.
Rate Movement: PECO rates remained remarkably stable through late 2021 (6.60-7.02¢/kWh), but December 2021 marked the beginning of increases.
Global Energy Tensions:
- Russia began restricting gas supplies to Europe in late 2021
- European natural gas prices soared by over 500%
- Economic recovery increased demand faster than supply growth
- US LNG exports began increasing to serve desperate European demand
- Natural gas storage remained below normal levels
The Calm Before the Storm: Philadelphia consumers enjoyed one last year of affordable electricity before the global energy crisis would drive rates to unprecedented highs.
The Catalyst: Russia's full-scale invasion of Ukraine triggered the first truly global energy crisis since the 1970s oil shocks.
Key Facts:
- Russia supplied 45% of EU's natural gas imports (185 bcm annually)
- European gas prices reached 10x pre-war levels
- Russia reduced exports to Europe by 150 bcm in 2022
- US became Europe's emergency LNG supplier
- Energy weaponized as tool of geopolitical coercion
PECO Rate Feb 2022: 7.02¢/kWh - still only 9% above 2021 baseline, but the lag effect meant worse was coming.
Market Transformation: This event permanently linked Philadelphia electricity prices to European energy security, creating a new era of higher, more volatile rates.
PECO Rate Progression:
- February 2022: 7.02¢/kWh
- May 2022: 7.07¢/kWh
- August 2022: 7.64¢/kWh (+8%)
- November 2022: 8.51¢/kWh (+11%)
Natural Gas Crisis Peaks:
- Henry Hub hit $9.85/MMBtu on August 22, 2022 (60% higher than January)
- Historical price volatility: 171% (highest since 1994)
- European gas exceeded 200/MWh
- Average 2022 Henry Hub: $6.45/MMBtu (highest since 2008, +53% YoY)
Freeport LNG Explosion (June 8, 2022):
- Major export terminal (17% of US capacity) shut down
- Created temporary US price relief but worsened Europe's crisis
- Stayed offline until February 2023
- Utilities locked into high-price contracts couldn't benefit
Consumer Impact: By November 2022, PECO customers saw rates 29% higher than the May 2021 baseline, with the worst yet to come.
PECO Rates Surge to Record Highs:
- February 2023: 9.86¢/kWh (+40% vs Nov 2022)
- May 2023: 9.73¢/kWh (sustained high)
- August 2023: 10.31¢/kWh (peak rate, +35% vs Aug 2022)
- November 2023: 9.67¢/kWh (slight moderation)
The Paradox - Natural Gas Prices Fell:
- January 2023: Natural gas dropped 41% from December 2022
- Average 2023 Henry Hub: $2.66/MMBtu vs $6.54 in 2022 (down 59%!)
- European gas prices collapsed from 200+ to ~30/MWh
- Europe's gas storage reached record highs (90%+)
Why PECO Rates Peaked When Gas Fell - The Lag Effect:
- Contract Timing: PECO purchased gas in 2022 at crisis prices ($6-9/MMBtu) on long-term contracts being consumed in 2023
- Storage Costs: Expensive gas stored in 2022 withdrawn and used in 2023
- Regulatory Process: Rate case approvals take 6-12 months minimum
- Cost Recovery: Utilities recovering under-collections from crisis period
- Infrastructure Investments: Grid resilience upgrades amortized into rates
Peak Impact: August 2023's 10.31¢ rate was 64% higher than May 2021's 6.27¢ baseline - the steepest increase in PECO's modern history.
PECO Rates Begin Declining:
- February 2024: 8.92¢/kWh (down 9.5% from Feb 2023)
- May 2024: 9.43¢/kWh (down 3% from May 2023)
- August 2024: 9.28¢/kWh (down 10% from Aug 2023 peak)
- November 2024: 9.24¢/kWh (down 4.4% from Nov 2023)
Natural Gas Market Stabilizes:
- 2024 Q1: $2.10/MMBtu (near record lows)
- Lower wholesale costs finally flowing through to retail rates
- Europe's gas storage maintained at healthy levels
- LNG markets less stressed than 2022-2023
Why Rates Remained 42-50% Above Baseline:
- Structural Market Changes: Natural gas no longer cheap domestic fuel
- Globalization Premium: US prices tied to international LNG markets
- Infrastructure Costs: Grid modernization investments being recovered
- Ongoing Volatility: Price swings still 50% above pre-2022 norms
The New Normal Emerges: While rates declined from 2023 peaks, they stabilized far above pre-crisis levels, signaling a permanent shift in Pennsylvania's electricity cost structure.
PECO Rate Trajectory:
- February 2025: 9.27¢/kWh (slight increase)
- May 2025: 9.24¢/kWh (stable)
- November 2025: 10.40¢/kWh (+12.5% jump!)
The November 2025 Surprise: After nearly two years of gradual rate declines from the 2023 peak, November 2025 saw rates surge to 10.40¢/kWh - approaching the August 2023 record high of 10.31¢.
Why Rates Increased in Late 2025:
- Lagged Cost Recovery: Final pass-through of 2022-2023 procurement costs
- Infrastructure True-Up: Accumulated grid investment costs approved by regulators
- Market Volatility: Natural gas price volatility remaining elevated
- Winter Demand Expectations: Forward contracts for winter 2025-26
- Geopolitical Tensions: Ongoing Ukraine conflict, Middle East instability
Natural Gas Outlook (2025-2026):
- Forecast: $3.00-4.10/MMBtu (structurally higher than 2017-2020)
- US LNG export capacity set to double by 2028
- Continued global demand tying US prices to world markets
- Price volatility 50-90% above historical norms
The 61.7% Reality: From 6.43¢ (Feb 2021) to 10.40¢ (Nov 2025), Philadelphia-area customers are paying 61.7% more for electricity.
Consumer Impact: A Philadelphia household using 1,000 kWh/month pays approximately $104/month in November 2025 vs $64/month in early 2021 - an additional $40/month or $480/year.
The New Normal: Rates will likely fluctuate between 9-10.5¢/kWh going forward but won't return to the 6¢ era. The age of cheap electricity in Philadelphia is permanently over.
Understand Your PECO Bill
Your PECO bill contains many details that can be confusing to customers. But there's lots of useful information to help you better understand your usage and rate. Below, we break down the most important items on a sample PECO Electric bill.
PECO Sample Bill
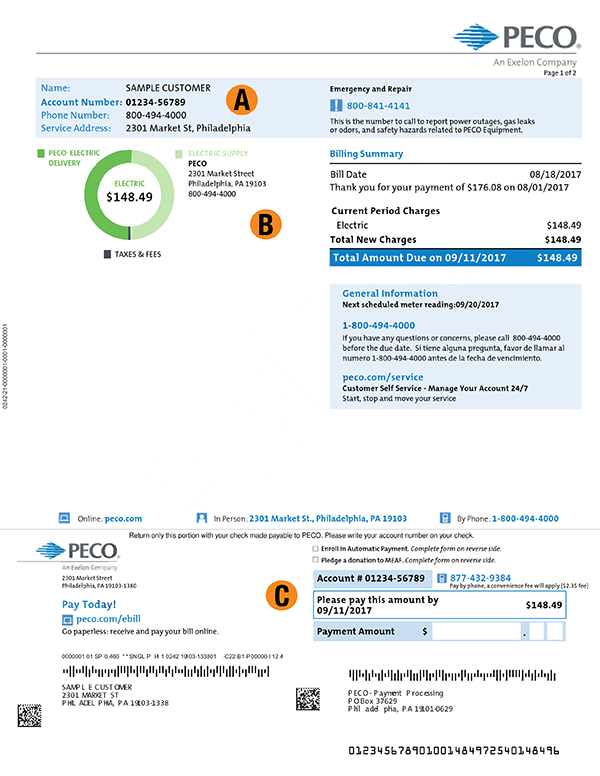
- : Billing Information. This includes your name, 10 digit PECO account number, service address, and phone number.
- : Billing Summary. This details the bill's date, the billing period, the amount paid in your last bill, and the current charges due. The General Information line shows the date of the next meter read.
- : Billing Payment Stub. This includes your 10 digit PECO account number, the amount due, the due date, service address, and the Customer Service phone number. The stub comes pre-addressed for your convenience if you mail your payment.
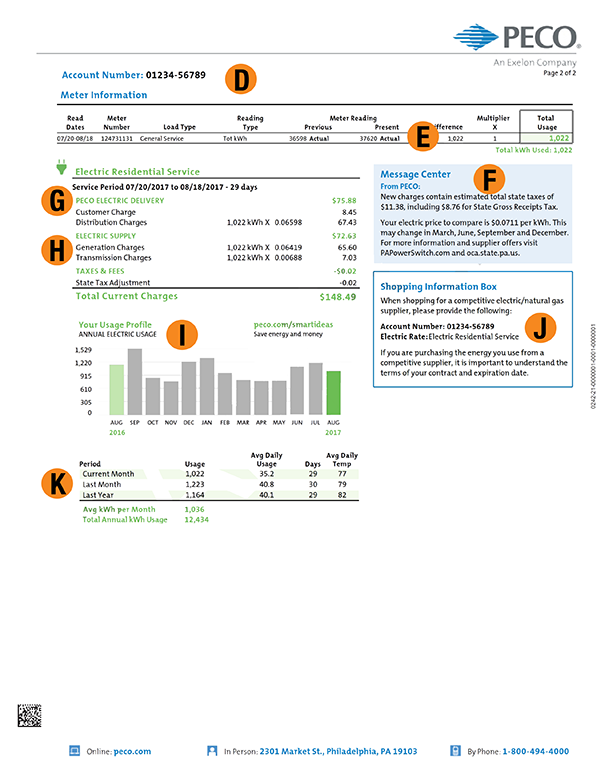
- : The top of Page 2 begins with your 10 digit PECO account number.
- : Meter Information: This shows the usage information measured by the electric meter at your address and includes the read date, meter number, the acutal metering numbers, and the total usage.
- : Message Center: Here you can find important notifications from PECO.
- : Shows PECO's monthly customer charges, the delivery charges and rate, and then the total PECO charges due.
- : This shows the charges due from your Electric Generation Supplier. PECO breaks down its PTC rate the show both generation supply charges and transmission charges. Retail suppliers only show their supply charges because transmission is already included in their pricing.
- : Shows your usage history per bill over the course of the past year to help you compare your energy use over time and understand your usage habits.
- : In order to switch to a new retail electricity provider, you'll need to provide them with your 10 digit supplier agreement ID number and your service type (ie. residential). This is different from your PECO account number.
- : This shows a breakdown of your current month's usage, usuage from the previous month, and from the same time last year. It also shows the average daily temperature so you can gauge how well your home heats and cools.
Ready to choose your energy rate?
Enter your ZIP code to explore the best energy plans in your area. Compare energy rates side by side, and choose the one that fits your home and budget.
