
Rated 5/5
Based on over 41,000 reviews
40%
Save up to 40%
100+
Electricity Providers
40+
Natural Gas Providers
Met-Ed Service Area Map
Met-Ed serves more than 560,000 customers in southeast Pennsylvania..
Cities Served By Met-Ed
Met-Ed serves: Bethlehem, Reading, Easton, Lancaster, and York across 14 counties in Southeastern Pennsylvania.
Counties Served By Met-Ed
| Adams | Berks | Bucks |
| Dauphin | Lancaster | Lebanon |
| Montgomery | Northampton | Pike |
| Chester | Cumberland | |
| Lehigh | Monroe | |
| York |

Met-Ed Electricity Rate Price Alert!
The lowest Electricity rate in the service area is 12.800¢ per kwh. That is 8.3% lower than Met Ed's Price to Compare of 13.951¢ per kwh.
Compare The Best Met-Ed Electricity Rates
We've researched the best providers and plans so you can find a great electricity rate in Pennsylvania
| Company | Term | Rate |
|---|---|---|
| American Power & Gas | 1/months | 7.4¢/kWh |
| Clearview Energy | 6/months | 9.6¢/kWh |
| Indra Energy | 2/months | 10.1¢/kWh |
| Public Power | 12/months | 10.7¢/kWh |
| APG&E | 12/months | 11.2¢/kWh |
| Direct Energy | 6/months | 11.6¢/kWh |
| XOOM Energy | 6/months | 11.7¢/kWh |
| Inspire Clean Energy | 6/months | 11.9¢/kWh |
| Frontier Utilities | 12/months | 12.2¢/kWh |
| Energy Harbor | 6/months | 13.0¢/kWh |
Compare Met-Ed Business Electricity Rates
You have the power to choose your Commercial and Met Ed Small Business Electricity Rates. The Utility Rates commercial electricity marketplace is exclusively for business electricity customers looking to start commercial service or compare their existing commercial electricity rates.
Met Ed business electricity rates are some of the lowest in the US and are 20-30% less than residential rates. So, if you're starting a business or just want to compare Met Ed commercial electricity rates and shop the market for a better rate, you could save thousands each year by shopping for a lower rate.
Met Ed Commercial Electricity Rates


What is the Met-Ed Price to Compare (PTC)?
The Price to Compare is the price the utility pays generator companies for electricity. It includes the price to generate the electricity, as well as the cost to transmit it over high voltage transmission power lines to Met-Ed's local electrical switch yards. From there, the electricity is distributed throughout the Met-Ed controlled grid for delivery to homes.
Met-Ed sets its PTC rates by holding auctions 4 times per year: March 1, June 1, September 1, and December 1. As a result, Met-Ed's PTC rates change every three months. Additionally, when the auctions are over, the PA PUC must approve the prices for both the generation supply and transmission.
Met-Ed's current Price to Compare is 11.90¢ per kWh
For customers, PTC electricity rates fluctuated throughout the year and can vary with the seasons; low some months, and higher during others.
Met-Ed Price to Compare - Historical Rates 2014-2026

Met-Ed Price to Compare - Analysis 2014-2026
Major Events Affecting Met-Ed Price to Compare Prices
Met-Ed Rates: 5.42-6.17 ¢/kWh
Natural Gas Context: Prices were low and stable during this period. The pandemic had reduced energy demand globally, keeping natural gas prices suppressed.
Significance: This represents the baseline "normal" pricing before the energy crisis began. These low rates would never return.
What Happened: A severe winter storm hit Texas and Oklahoma, causing widespread natural gas production freeze-offs and blackouts.
Impact on Met-Ed: While Met-Ed serves Pennsylvania (not directly affected by the Texas freeze), the event caused a nationwide spike in natural gas prices that rippled through all electricity markets.
Price Effect: Natural gas prices briefly spiked and remained elevated through October 2021. This was the first warning sign of system vulnerabilities that would worsen in 2022.
Storage Impact: The storm depleted natural gas storage inventories, setting the stage for the 2021-2022 price increases.
Met-Ed Rate Increase: +23.5% jump from May to August 2021 (5.42¢ 6.69¢/kWh)
What Happened:
- Economic recovery from pandemic increased energy demand faster than supply could respond
- Natural gas storage remained depleted from Winter Storm Uri
- International demand for US LNG began increasing
- Russia started restricting gas supplies to Europe in late 2021
By November 2021: Met-Ed rates reached 7.11¢/kWh, up 31% from the May low. The pre-crisis era was officially over.
The Trigger Event: Russia's full-scale invasion triggered the first truly global energy crisis.
Key Facts:
- Russia supplied 45% of EU's natural gas imports before the war
- European gas prices reached levels 10x higher than the previous 15-year average
- US became Europe's crucial LNG supplier overnight
- Russia reduced exports to Europe by 150 billion cubic meters in 2022
Met-Ed Rate at Feb 2022: 7.41¢/kWh, but this would surge dramatically in the coming months as wholesale gas prices exploded.
Cascading Effects: The weaponization of energy supply caused a fundamental restructuring of global gas markets. US natural gas, previously isolated from world prices, became permanently linked to international events.
What Happened: An explosion shut down the Freeport LNG terminal in Texas, representing 17% of US LNG export capacity (~2 Bcf/d).
The Paradox:
- Initially predicted to reopen in weeks, stayed offline until February 2023
- US domestic natural gas prices temporarily fell (oversupply)
- European prices remained elevated (less LNG available)
- Electricity rates continued rising due to earlier contracted high gas prices
Met-Ed Context: Between May and November 2022, rates jumped from 6.83¢ to 9.40¢/kWh (+38%), reflecting the extreme volatility in wholesale natural gas markets despite the Freeport outage temporarily lowering spot prices.
Met-Ed Rate Surge:
- August 2022: 7.94¢/kWh (+16% from May)
- November 2022: 9.40¢/kWh (+18% from August)
- Total increase since May: +38%
Crisis Metrics:
- Henry Hub natural gas: Peaked at $9.85/MMBtu (Aug 22)
- Historical price volatility: 171% (highest since 1994)
- European natural gas: Exceeded 200/MWh
- Annual 2022 average: $6.45/MMBtu (highest since 2008)
Why Rates Surged: Unprecedented uncertainty as Europe scrambled for LNG alternatives to Russian pipeline gas. The convergence of the Ukraine war, Freeport outage, and surging global demand created perfect storm conditions.
Met-Ed Rates Remain Elevated:
- May 2023: 9.99¢/kWh
- August-November 2023: 10.24¢/kWh
- December 2023: 10.30¢/kWh
Natural Gas Context: Wholesale natural gas prices fell dramatically:
- January 2023: Dropped 41% from December 2022
- Average 2023 Henry Hub: $2.66/MMBtu vs $6.54/MMBtu in 2022
- European gas prices dropped from 200+ to ~30/MWh
The Lag Effect: Electricity rates remained high even as natural gas prices fell because:
- Utilities purchased gas on long-term contracts at 2022's high prices
- Regulatory rate adjustments take time to implement
- Infrastructure upgrade costs being passed through
- Utilities recovering losses from the crisis period
Met-Ed Hits New High: May 2024 reached 11.31¢/kWh, the highest rate in the dataset at that time (96% above May 2021 baseline).
Why Rates Peaked in 2024:
- Full pass-through of 2022-2023 high gas procurement costs
- Infrastructure investment costs from resilience improvements
- Regulatory adjustments catching up to actual costs
- Natural gas market volatility still 50% above pre-2022 levels
Rates Moderated: By August-November 2024, rates declined to 10.40¢/kWh as some cost pressures eased, but remained double the 2020 baseline.
Current Met-Ed Rates:
- May 2025: 11.01¢/kWh
- September 2025: 11.90¢/kWh (all-time high)
- November 2025: 11.57¢/kWh
Natural Gas Outlook:
- 2024 Q1: $2.10/MMBtu (near record lows)
- 2025-26 forecast: $3.00-4.10/MMBtu
- Price volatility remains elevated above historical norms
Why Rates Are 101% Higher Than 2020:
- Globalization: US LNG exports tie domestic prices to international markets permanently
- Infrastructure Costs: Grid modernization and resilience investments
- Structural Change: Natural gas no longer a cheap, abundant domestic fuel
- Geopolitical Premium: Ongoing tensions create supply uncertainty
- Renewable Transition: Costs of grid transformation passed to consumers
Future Outlook: Rates will likely stabilize in the 10-12¢/kWh range but won't return to pre-2021 levels. The era of 5-6¢/kWh electricity is over.
How to Start New Met-Ed Service
Fill in the online Start Service form on Met-Ed's website. This takes at least 2 days to process and you will receive email confirmation when it's completed. Contact the Met-Ed Contact Center if you have an urgent request.
Met-Ed may check your credit, and charge a deposit to start service based on your credit history. Not everyone will require a security deposit, and in some instances, the security deposit may be waived.
You'll need to give the following information when you apply for service:
- Name
- Date of birth
- The service Addres
- Phone number
- Desired start date
- Social Security number
Met-Ed Sample Bill
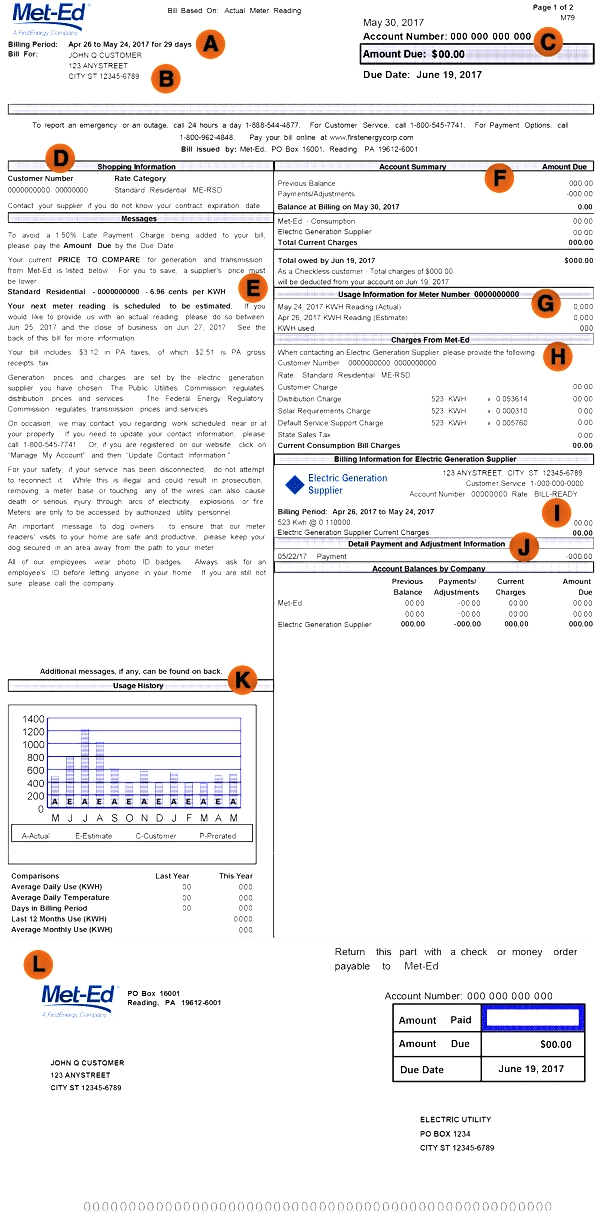
- A, B, & C: Account & bill information, including personal details such as your address and personal account number with Met-Ed, the billing period, the amount due, and the date that the bill is due.
- D & E: Messages and current PTC rate. Here you find important notifications from Met-Ed as well as current Price to Compare rate offered by Met-Ed.
- F: Account Summary. This includes current Met-Ed distribution charges and current supply charges. It also shows your total bill, any unpaid bills, and the due date.
- G: Meter Summary: This shows the usage measured by the electric meter at your address.
- H: Summary of Charges from Met-Ed, including your rate type, your current rate, monthly customer charges and the total bill.
- I: Summary of Charges from Electricity Generation Supplier, including the company's name, their base rate, and total supplier charges due.
- J: Account Balances by Company shows the amounts that have been paid or are owed to Met-Ed and your supplier.
- K: Usage history over time. This details your power consumption to help budget planning.
- L: Payment Stub. Just detach and return with your payment. It also includes your account number, amount paid, amount due, and the due date.
What are Met-Ed delivery and supply charges?
Pennsylvania residential customers now pay separate charges for the cost to deliver their electricity and for the amount of electricity supply that they use.
Because Met-Ed owns and maintains the the distribution network, all electricity customers must pay a distribution charge no matter which supplier they have. All customers pay the same rate depending on their service class.
Utility distribution rates are overseen by the PA PUC and can periodically change. Assuming an average usage of 864 kWh per month, the Met-Ed distribution portion of a bill could look like this:
| Rate of $$0.048 per kWh | Monthly Customer Charge | Total | |
| Monthly Distribution Charges (excluding riders) | $41.47 for 864 kWh Used | $11.25 | $52.72 |
Ready to choose your energy rate?
Enter your ZIP code to explore the best energy plans in your area. Compare energy rates side by side, and choose the one that fits your home and budget.
