
Rated 5/5
Based on over 41,000 reviews
40%
Save up to 40%
100+
Electricity Providers
40+
Natural Gas Providers
Recommended Duquesne Electricity Plans
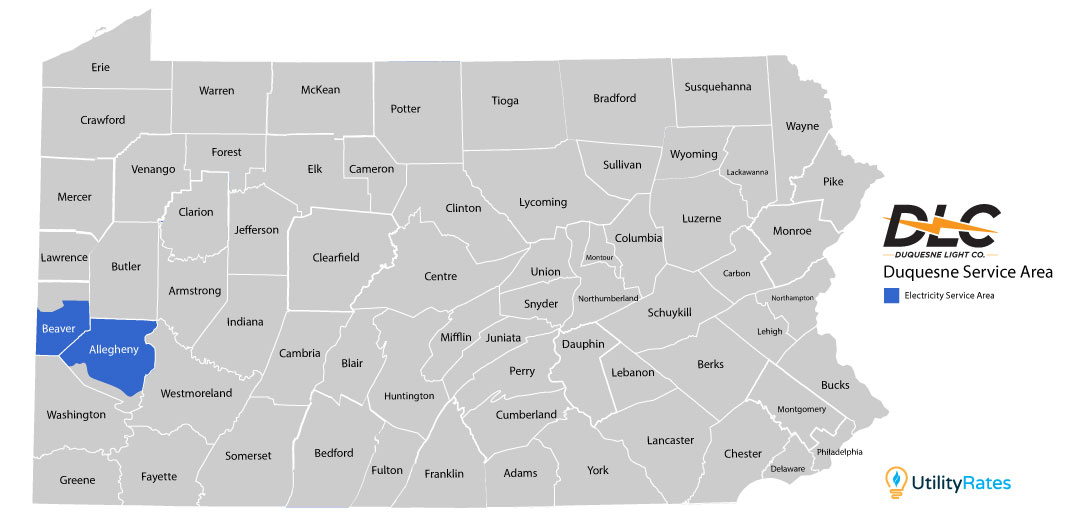
Duquesne Light Company Service Area Map
Duquesne Light serves more than 720,000 customers in central and western Pennsylvania.
Cities served by Duquesne Light
Duquesne Light serves: Butler, Canonsburg, Greencastle, Uniontown, Waynesburg across 24 counties in central and western Pennsylvania.
Duquesne Electricity Rate Price Alert!
The lowest Electricity rate in the service area is 12.290¢ per kwh. That is 13.1% lower than Duquesne's Price to Compare of 14.14¢ per kwh.
Compare The Best DLC Electricity Rates
We've researched the best providers and plans so you can find a great electricity rate in Pennsylvania
| Company | Term | Rate |
|---|---|---|
| American Power & Gas | 1/months | 8.0¢/kWh |
| Public Power | 12/months | 11.5¢/kWh |
| Inspire Clean Energy | 5/months | 12.1¢/kWh |
| Direct Energy | 6/months | 12.2¢/kWh |
| Energy Harbor | 15/months | 13.0¢/kWh |
| Green Mountain Energy | 12/months | 13.1¢/kWh |
| XOOM Energy | 6/months | 13.6¢/kWh |
| Constellation | 6/months | 13.7¢/kWh |
| NRG Home | 12/months | 14.0¢/kWh |
| Verde Energy | 12/months | 14.6¢/kWh |
| Company | Term | Rate |
|---|---|---|
| Clearview Energy | 18/months | 10.3¢/kWh |
| APG&E | 17/months | 12.5¢/kWh |
| Company | Term | Rate |
|---|---|---|
| Major Energy | 12/months | 13.4¢/kWh |
| Company | Term | Rate |
|---|---|---|
| Frontier Utilities | 12/months | 13.6¢/kWh |
| Santanna Energy Services | 12/months | 14.8¢/kWh |
Compare Duquesne Light Business Electricity Rates
You have the power to choose your Commercial and Duquesne Light Small Business Electricity Rates. The Utility Rates commercial electricity marketplace is exclusively for business electricity customers looking to start commercial service or compare their existing commercial electricity rates.
PP&L business electricity rates are some of the lowest in the US and are 20-30% less than residential rates. So, if you're starting a business or just want to compare Duquesne Light commercial electricity rates and shop the market for a better rate, you could save thousands each year by shopping for a lower rate.
Duquesne Light Commercial Electricity Rates


Duquesne Light Price to Compare - Historical Rates 2017-2026

Duquesne Light Price to Compare - Analysis 2018-2026
Major Events Affecting Duquesne Light Price to Beat Prices
Duquesne Light Rates: 7.07-7.96 ¢/kWh (very stable)
Natural Gas Context: The US shale gas revolution created an abundance of cheap domestic natural gas. Henry Hub prices averaged $2.50-3.15/MMBtu during this period.
Market Characteristics:
- Minimal price volatility (rates varied less than 1¢ over 3+ years)
- Natural gas primarily domestic commodity
- Limited LNG export infrastructure
- Predictable, affordable energy for Pittsburgh-area consumers
Significance: This 3-year stability represents the baseline "normal" that would be permanently disrupted. These low rates would never return.
What Happened: A severe winter storm hit Texas and Oklahoma, causing widespread natural gas production freeze-offs and multi-day blackouts affecting millions.
Impact on Duquesne Light: While Pennsylvania wasn't directly affected by the freeze, the event caused nationwide natural gas price spikes that rippled through all electricity markets.
Rate Movement: Duquesne Light rates remained relatively stable at 7.07¢/kWh during the immediate aftermath but began climbing by mid-2021 (7.41¢) as the broader impacts became clear.
Why It Mattered:
- Exposed infrastructure vulnerabilities to extreme weather
- Depleted natural gas storage inventories nationally
- Set the stage for the 2022 crisis by creating supply tightness
- Demonstrated interconnected nature of US energy markets
Rate Movement: June-November 2021 saw rates edge up from 7.41¢ to 7.41¢ (stable), but December 2021 jumped to 7.98¢ (+7.7%).
Global Context:
- Russia began restricting gas supplies to Europe in late 2021
- European natural gas prices soared by over 500%
- Economic recovery from pandemic increased demand faster than supply
- US LNG exports began increasing to serve European demand
- Natural gas storage remained below normal after Winter Storm Uri
The Warning Sign: The December 2021 rate increase signaled the end of the stable era. Pittsburgh consumers were about to be connected to global energy turmoil.
The Catalyst: Russia's full-scale invasion of Ukraine triggered the first truly global energy crisis, fundamentally restructuring world energy markets.
Key Facts:
- Russia supplied 45% of EU's natural gas imports before the war (185 bcm annually)
- European gas prices reached levels 10x higher than the previous 15-year average
- Russia reduced exports to Europe by 150 bcm in 2022
- US became Europe's crucial LNG supplier overnight
- Energy was weaponized as a tool of geopolitical coercion
Duquesne Light Rate at Feb 2022: 7.98¢/kWh, but this would surge dramatically as wholesale gas markets exploded.
The Permanent Shift: This event permanently linked Pennsylvania electricity prices to European energy security, Middle East tensions, and Asian LNG demand.
Dramatic Jump: June 2022 rates hit 9.36¢/kWh, a +17.3% increase from December 2021's 7.98¢.
What Drove This:
- Russia further curtailed gas exports to Europe
- US LNG exports surged to fill the gap (72% to Europe vs 29% historically)
- Domestic natural gas prices rose as supply went overseas
- Wholesale Henry Hub prices climbing toward $9.85/MMBtu peak (reached Aug 22)
Freeport LNG Explosion (June 8, 2022):
- Major US export terminal (17% of capacity) shut down
- Created paradox: US spot prices fell, but electricity rates kept rising
- Europe's energy crisis worsened (less LNG available)
- Utilities locked into high-price contracts couldn't benefit from lower spot prices
Consumer Impact: Pittsburgh-area households saw their electricity costs jump by over $15/month for average usage, with more increases coming.
Massive Spike: December 2022 rates jumped to 11.25¢/kWh, a +20.2% increase from June's already-elevated 9.36¢.
Crisis Metrics (2022):
- Henry Hub natural gas peaked at $9.85/MMBtu (Aug 22, 2022)
- Historical price volatility: 171% (highest since 1994)
- European natural gas exceeded 200/MWh
- Average 2022 Henry Hub: $6.45/MMBtu (highest since 2008, +53% YoY)
- Nord Stream pipeline sabotaged (September 2022)
Why Rates Exploded:
- Utilities passing through extreme Q3 2022 gas procurement costs
- Unprecedented market uncertainty and volatility
- Europe's desperate competition for LNG raising all prices
- Storage costs inflated by crisis-level pricing
The 59% Increase: From baseline 7.07¢ (Dec 2020) to 11.25¢ (Dec 2022), Pittsburgh customers saw rates increase 59% in just two years.
Rates Remain Elevated:
- December 2022: 11.25¢/kWh
- June 2023: 11.45¢/kWh (slight increase)
- December 2023: 10.46¢/kWh (modest decline)
Natural Gas Price Decline:
- January 2023: Fell 41% from December 2022
- Average 2023 Henry Hub: $2.66/MMBtu vs $6.54 in 2022 (down 59%)
- European gas prices dropped from 200+ to ~30/MWh
- Europe's gas storage reached record highs (90%+)
The Lag Effect in Action: Despite wholesale natural gas returning to near-normal prices, Duquesne Light rates remained 48-62% above pre-crisis levels throughout 2023.
Why Rates Stayed High:
- Contract Timing: Utilities purchased gas in 2022 at crisis prices on long-term contracts
- Storage Costs: Gas stored at $6-9/MMBtu being consumed in 2023
- Regulatory Lag: Rate adjustments take 6-12 months for approval
- Cost Recovery: Utilities recovering under-collections from crisis period
- Infrastructure Investment: Grid resilience upgrades being amortized
Rate Fluctuations:
- December 2023: 10.46¢/kWh
- June 2024: 10.53¢/kWh (relatively stable)
- September 2024: 11.85¢/kWh (+12.5% jump!)
- December 2024: 10.85¢/kWh (moderation)
Natural Gas Context (2024):
- Q1 2024: $2.10/MMBtu (near record lows)
- Price volatility remained 50% above pre-2022 historical norms
- Winter Storm Heather (January 2024) caused temporary spikes
- Continued high LNG export demand maintained structural price support
The September Surprise: The sudden 12.5% jump to 11.85¢ in September 2024 demonstrated that volatility remains a permanent feature of the new energy market reality.
Why Volatility Persists:
- Global LNG markets remain tight with limited spare capacity
- Geopolitical tensions (Ukraine, Middle East) create supply uncertainty
- Weather extremes drive demand spikes
- US domestic prices now swing with international events
All-Time High: June 2025 hit 12.43¢/kWh, the highest rate in Duquesne Light's modern history.
Rate Progression:
- December 2024: 10.85¢/kWh
- June 2025: 12.43¢/kWh (+14.6% increase!)
- November 2025: 12.43¢/kWh (sustained peak)
The 75.8% Reality: From the 7.07¢ baseline (Dec 2020) to 12.43¢ (June 2025), Pittsburgh-area customers are paying 75.8% more for electricity.
Why 2025 Peaked Years After the Acute Crisis:
- Full Cost Flow-Through: All 2022-2023 high procurement costs finally passed to customers
- Infrastructure Recovery: Billions in grid modernization costs amortized into rates
- Regulatory True-Ups: Years of under-recovery being corrected
- Structural Market Changes: Higher baseline costs from globalized gas markets
Natural Gas Outlook (2025-2026):
- Forecast: $3.00-4.10/MMBtu (structurally higher than 2017-2020)
- US LNG export capacity doubling by 2028
- Volatility to remain 50-90% above historical norms
- Ongoing Ukraine conflict maintaining geopolitical risk premium
The New Normal: Rates will likely stabilize in the 10.50-12.50¢/kWh range but won't return to pre-2021 levels. The era of 7¢/kWh electricity in Pittsburgh is permanently over.
Consumer Impact: A Pittsburgh household using 1,000 kWh/month now pays approximately $124/month vs $71/month in 2020 - an additional $53/month or $636/year.
Ready to choose your energy rate?
Enter your ZIP code to explore the best energy plans in your area. Compare energy rates side by side, and choose the one that fits your home and budget.
